How Do You Measure and Report on GEO Performance to Actually Prove ROI?
GEO reporting represents a shift from SEO-style scorecards to funnel-based metrics.

AthenaHQ
Action on AI Search
Key Takeaways
- Traditional SEO metrics like rankings and click-through rate don't capture AI search impact; GEO reporting instead relies on Share of Voice, Average Brand Mentions, Daily Citations, Mentions Per Prompt, AI-Sourced Leads, and ROI Per Prompt.
- GEO reporting is shifting from scorecard-style metrics to funnel-based reporting, where visibility metrics like Share of Voice feed into pipeline metrics like AI-Sourced Leads and ROI Per Prompt.
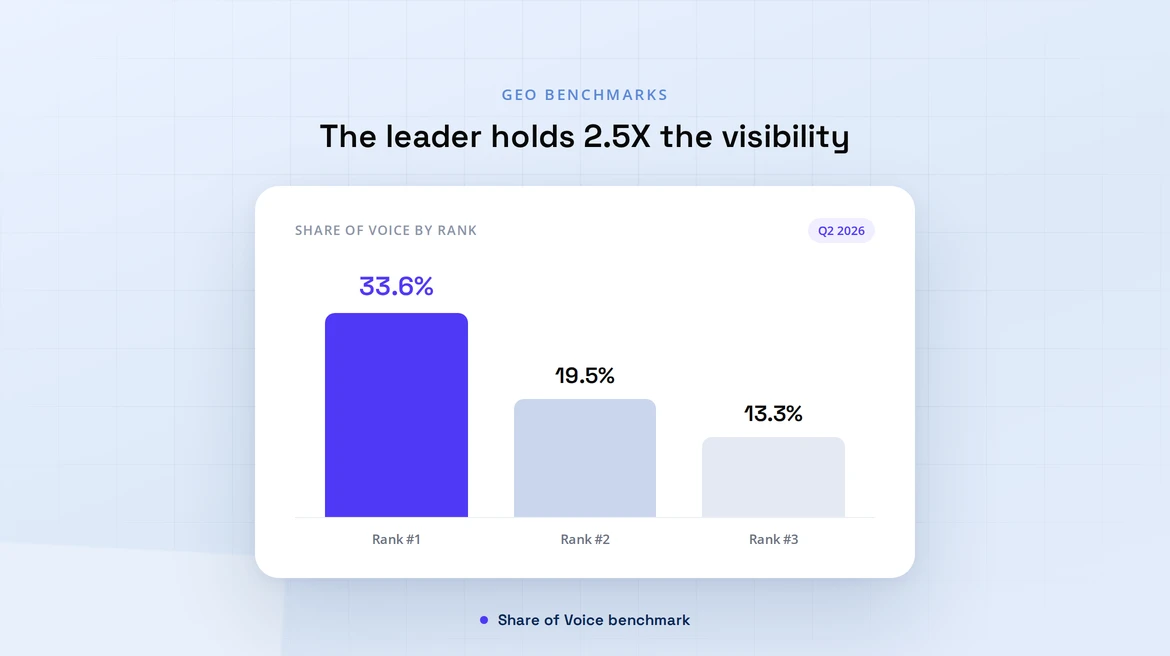
- Category leaders average 33.6% Share of Voice in AI-generated responses, compared to 19.5% for second place and 13.3% for third, meaning the top brand holds roughly 2.5X the visibility of the runner-up.
- Buyers who arrive via AI-generated answers tend to be further along in their decision journey with higher intent, meaning a smaller volume of AI-referred traffic can represent a disproportionately larger share of pipeline value.
- Recommended actions include tagging leads for AI-referral signals, reporting Share of Voice relative to top competitors collectively rather than in isolation, and pairing every visibility metric with a business outcome metric.
We created the State of AI Search 2026 Report to help marketers get a better sense of the ever-changing GEO landscape: specifically, trends we’ve observed from millions of data points spanning 8+ LLMs, including ChatGPT, Claude, and Perplexity. However, we also wanted to go deeper and contextualize our findings with real conversations with teams working in the trenches to expand their AI visibility. Today, we’re exploring one of the most common questions we’ve encountered on GEO reporting.
Methodology
Between December 2025 and March 2026, we collected and analyzed millions of AI-generated responses across B2B and B2C. We also layered the product data with a supplementary analysis of over 500 conversations in Q2 (April-June 2026), including enterprise demos, strategy sessions, and onboarding calls. We identified the most common questions and unresolved priorities for marketing teams building out GEO programs. These companies include both enterprise and mid-market teams, with a median average revenue of $933 million and median average size of 755 employees.
Each question in this blog series is answered with benchmark metrics compiled from our product data, along with a series of recommended action items to improve your GEO efforts. You can view the full reporthere.
How Do You Measure and Report on GEO Performance to Actually Prove ROI?
Traditional SEO reporting relies on rankings, impressions, and click-through rate, but when it comes to quantifying the impact of AI search, alternative metrics map more directly to business outcomes:
- Share of Voice
- Average Brand Mentions
- Daily Citations
- Mentions Per Prompt
- AI-Sourced Leads
- ROI Per Prompt
This represents a significant shift from scorecard to more funnel-based reporting: Share of Voice and Brand Mentions describe how often your brand appears in AI-generated responses overall, while Daily Citations and Mentions per Prompt describe how consistently specific content is being pulled into an answer. AI-Sourced Leads and ROI per Prompt are what actually justify budget, because they connect AI search visibility to actual pipeline.
In terms of benchmarks, leading brands average 33.6% Share of Voice, with a sharp drop to 19.5% for second place and 13.3% for third. This data shows that becoming a category leader to answer engines is worth roughly 2.5X times the visibility of the runner-up.
The data also shows that AI search converts users differently than traditional SEO: buyers who arrive after being informed by an AI-generated answer tend to be further along in their decision journey, arriving with higher intent and requiring less top-of-funnel education. That is a meaningful qualitative point to consider alongside more quantitative GEO metrics, since a smaller volume of AI-referred traffic may still represent a larger share of pipeline value than the raw session count suggests.
Action Items
- Tag inbound leads and conversions for AI-referral signals (direct traffic following a cited brand mention) so AI-Sourced Leads becomes a real, trackable line rather than an estimate.
- Report Share of Voice relative to the #1 and #2 competitors collectively, not in isolation. A rising Share of Voice that still trails the leader by 15+ points tells a different story than the same number in a fragmented category.
- Pair every visibility metric with a business outcome metric on the same slide, even directionally. This illustrates the connection between citation activity and pipeline, so stakeholders are less likely to treat GEO as a vanity report.
For more insights, check out the full State of AI Search 2026 report.
FAQs
How do you measure and report on GEO performance to prove ROI?
GEO performance is measured using six core metrics: Share of Voice, Average Brand Mentions, Daily Citations, Mentions Per Prompt, AI-Sourced Leads, and ROI Per Prompt. Share of Voice and Brand Mentions show how often a brand appears in AI-generated responses overall, Daily Citations and Mentions Per Prompt show how consistently specific content gets pulled into answers, and AI-Sourced Leads and ROI Per Prompt connect that visibility directly to pipeline, which is what actually justifies budget to stakeholders.
Why don't traditional SEO metrics work for measuring AI search performance?
Traditional SEO reporting relies on rankings, impressions, and click-through rate, but these metrics don't map directly to business outcomes in AI search. GEO reporting instead uses metrics like Share of Voice and AI-Sourced Leads, which are built to reflect how AI models present a brand and how that visibility translates into pipeline, marking a shift from scorecard-style reporting to funnel-based reporting.
What is a good Share of Voice benchmark in AI search?
Leading brands average 33.6% Share of Voice in AI-generated responses, while second place averages 19.5% and third place averages 13.3%. This gap shows that the category leader typically holds roughly 2.5 times the visibility of the runner-up, so becoming the top brand in a category carries an outsized advantage over simply improving from a lower position.
Does AI search traffic convert differently than traditional SEO traffic?
Yes. Buyers who arrive after being informed by an AI-generated answer tend to be further along in their decision journey, arrive with higher intent, and require less top-of-funnel education. As a result, a smaller volume of AI-referred traffic can still represent a larger share of pipeline value than the raw session count would suggest, which is an important qualitative point to pair with quantitative GEO metrics.
How should Share of Voice be reported to stakeholders?
Share of Voice should be reported relative to the #1 and #2 competitors collectively, not in isolation. A rising Share of Voice that still trails the category leader by 15 or more points tells a very different competitive story than the same number would in a more fragmented category with no dominant leader.
How can marketing teams track AI-Sourced Leads accurately?
Teams should tag inbound leads and conversions for AI-referral signals, such as direct traffic that follows a cited brand mention. This turns AI-Sourced Leads into a real, trackable reporting line rather than an estimate, and makes it possible to connect citation activity to actual pipeline outcomes.
Why is it important to pair visibility metrics with business outcome metrics?
Pairing every visibility metric with a business outcome metric, even directionally, on the same reporting slide illustrates the direct connection between citation activity and pipeline. This makes stakeholders less likely to dismiss GEO reporting as a vanity metric disconnected from revenue impact.
What data supports these GEO reporting benchmarks?
The benchmarks come from millions of AI-generated responses collected between December 2025 and March 2026 across B2B and B2C, layered with a supplementary analysis of over 500 conversations in Q2 2026 (April–June), including enterprise demos, strategy sessions, and onboarding calls with enterprise and mid-market teams averaging $933 million in revenue and 755 employees.
Become the Brand AI Trusts
See, Act, and Win on AI Search and Beyond
Keep Reading
Enterprise GEO Prompts: Strategies for Scaling AI Search Visibility
Enterprise GEO provides a practical way for large teams to organize buyer questions, measure answers across engines, find citation gaps, invest in changes that carry real business value, and ultimately scale their AI search visibility.

How to Get Your Products Featured in AI Search Recommendations
Actually getting your products featured in AI search recommendations requires a repeatable process to sufficiently cover your grounds across product data, crawl access, third-party evidence, comparison content, and performance.
Free AI Search Visibility Tracking: Methods & Tools for 2026
See AthenaHQ in Action
 AthenaHQ
 Cozy Earth
The Most-Cited Sleepwear Brand in AI Search
Cozy Earth used AthenaHQ to protect its lead in sleepwear, identify a loungewear opportunity, and give its two-person content team a clearer way to prioritize what to publish next.
AthenaHQ Rootly
10x Increase in Citation Rate
GEO became Rootly's #1 growth pillar. With ~10x citation rate growth and +126% mention rate on non-branded prompts, Rootly transformed AI Search into an executive-level operating channel.
AthenaHQ Lago
Lago50% Increase in Demos from AI Search
Lago achieved a 50% increase in demos from AI Search after implementing Athena. With 11x growth in AI Overview impressions and exploding citations, Athena became their command center for GEO.