How to Measure E-Commerce Brand Share of Voice in AI Search Engines
Learn how to measure e-commerce brand share of voice in AI search, benchmark competitors, track AI citations, and connect visibility to revenue.

Andrew Yan
Co-Founder, CEO of AthenaHQ
Key Takeaways
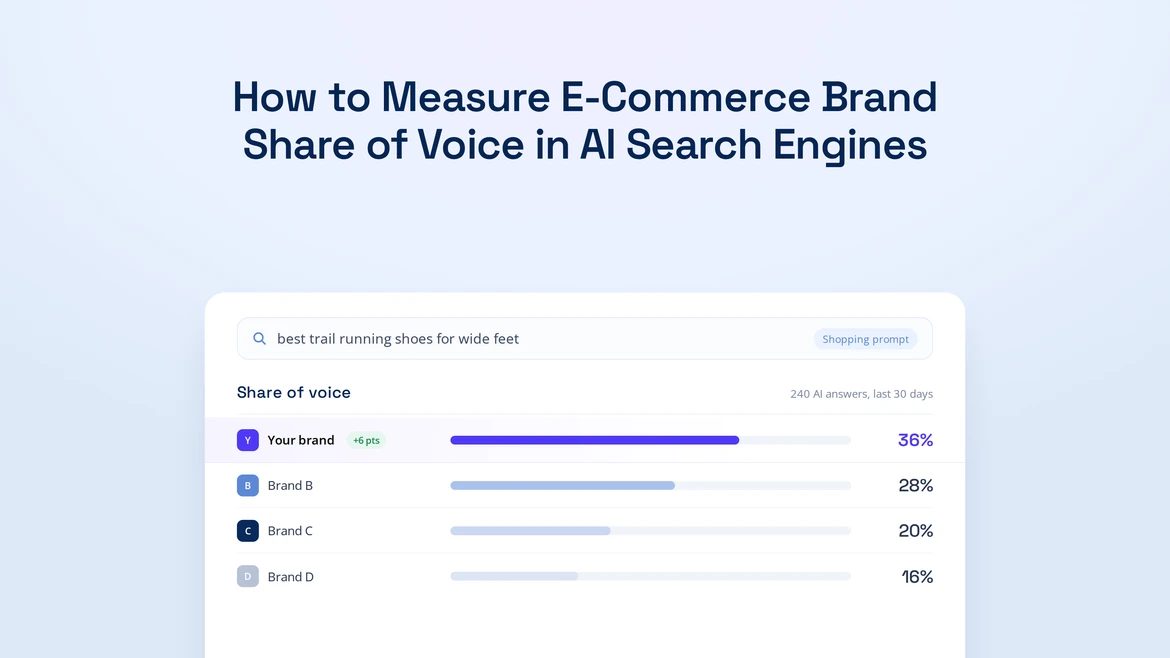
- AI share of voice measures how often your brand appears in AI-generated answers compared with competitors. Calculate it by dividing your brand mentions by all eligible brand mentions across a consistent set of prompts, AI engines, and reporting periods.
- Brand mentions, recommendations, and citations tell different stories about AI search visibility. Track each metric separately to understand how often AI platforms mention your brand, recommend your products, and cite your website.
- AI search visibility varies significantly across e-commerce brands. According to AthenaHQ’s State of AI Search report, the average Consumer Goods & Retail brand appears in 15.46% of tracked AI answers, compared with 53.21% for category leaders.
- Consistent measurement makes AI share-of-voice data more useful. Use the same prompts, competitors, AI engines, geographic markets, and reporting methods to identify meaningful changes in performance.
- Connect AI visibility with e-commerce outcomes to understand its business impact. Compare share of voice with referral traffic, product-page engagement, conversions, and revenue without assuming every AI mention leads to a sale.
Shopping journeys are changing. Instead of browsing search results and comparing product pages, consumers can now ask AI search engines to suggest products, explain differences, and help them decide what to buy.
For e-commerce brands, that creates a new visibility challenge. Traditional search rankings only tell part of the story. Marketers also need to know whether AI search engines mention their products, recommend them over competitors, and cite their websites.
Some brands are already pulling far ahead: AthenaHQ’s State of AI Search report found that the average Consumer Goods & Retail brand appears in just 15.46% of tracked AI answers, while category leaders achieve 53.21%.
So how do you know where your brand stands?
Measuring AI share of voice gives you a clearer picture of your competitive position across AI search platforms. It helps you understand which brands dominate relevant conversations, where your products appear, and which opportunities deserve your attention.
This guide walks through how to measure e-commerce brand share of voice in AI search, from building a representative prompt set to calculating visibility metrics and connecting the results to business performance. Let’s dive in!
Define AI Share of Voice Before You Start Calculating
AI share of voice tracks how often your brand appears in AI-generated answers relative to competitors across a defined set of prompts. This provides a benchmark for understanding your visibility within relevant product categories and purchase conversations. Before you start calculating, however, make sure you're measuring the right things. Each metric reveals something different about how AI platforms represent your brand, so it’s worth looking at several:
Mention share of voice represents your brand's portion of all eligible brand mentions within a tracked competitive set.
Mention share of voice = (Your brand mentions ÷ All tracked brand mentions) × 100
The denominator includes mentions of your brand and eligible competitors across the same prompts, AI engines, geographic markets, and reporting period. Count each eligible brand that appears in a response, even when AI recommends multiple products.
Recommendation rate captures the percentage of eligible AI responses that explicitly suggest your brand. An AI search engine can mention your products without recommending them, so it's important to distinguish general visibility from actual endorsements.
Citation share measures the percentage of eligible responses that cite your website. Track third-party citations separately to understand which external sources AI platforms reference when discussing your brand.
Two additional metrics can help you build a more complete picture:
- Position: Where your brand appears within an AI-generated answer, including its mention order or recommendation placement.
- Sentiment: Whether AI-generated answers describe your brand positively, neutrally, or negatively.
| Metric | What to count | Denominator | What it tells you |
| Mention share of voice | Eligible brand mentions | All counted brand mentions | Share of competitive discussion |
| Citation share | Responses citing your owned domain | All eligible responses | Frequency of direct website citations |
| Recommendation rate | Responses explicitly recommending your brand | All eligible responses | Frequency of product recommendations |
| Position | Appearance order | Responses mentioning your brand | Prominence within AI answers |
| Sentiment | Positive, neutral, or negative framing | Responses mentioning your brand | How AI represents your brand |
These distinctions also matter when you compare your performance against industry benchmarks. For example, AthenaHQ’s State of AI Search report found that leading Consumer Goods & Retail brands achieve an average 33.98% share of voice, compared with 18.57% for second-ranked brands and 12.81% for third-ranked brands.
Choose One Denominator and Keep It Fixed
A 30% share of voice might look impressive on a dashboard. But what does that number actually tell you? That depends on what you counted.
To calculate mention share of voice, divide your brand mentions by all eligible brand mentions within your competitive set. Recommendation and citation rates, meanwhile, use the total number of eligible responses.
Be sure to exclude prompts outside your measured category and runs that fail to produce an answer. It’s a good idea to document these exclusions so you can apply the same rules in future reporting periods.
Consistency matters more than complexity. You can introduce weighted metrics later to account for mention order or recommendation prominence, but start with a straightforward calculation that you can reproduce and explain.
Build a Comparable E-Commerce AI Search Measurement Set
A reliable measurement process starts with a representative sample of the questions your customers ask AI search engines. From there, you need to decide which platforms to monitor, which competitors to include, and how often to collect results. Follow these seven steps to build a consistent measurement set:
- Define your product category and target audience.
- Select representative search prompts.
- Choose the AI search engines you want to monitor.
- Establish rules for which competitors to include.
- Run prompts on a consistent schedule.
- Record and classify every response.
- Calculate, segment, and compare your results.
Create a Representative Prompt Portfolio
Think about the questions customers actually ask before making a purchase. Some shoppers may be exploring a new category, while others already know what they want and need help comparing their options. Your prompt portfolio should reflect these different stages of the buying journey. Organize non-branded prompts into six categories:
- Category discovery: “What are the best running shoes for beginners?”
- Product-specific needs: “Which running shoes provide the best arch support?”
- Product comparisons: “How do Brand A and Brand B running shoes compare?”
- Gifts: “What are good running shoe gifts for marathon runners?”
- Seasonal or promotional needs: “Which running shoes are worth buying during Black Friday?”
- High-intent purchase questions: “Where can I buy lightweight running shoes under $150?”
Keep branded prompts in a separate category. Otherwise, questions that already mention your brand can make your discovery visibility appear stronger than it really is.
Record the exact wording of every prompt, along with its product category and purchase-intent cluster. Small changes in phrasing can produce different answers, so consistency is essential.
You'll also need to establish which brands qualify as competitors within each category. When an AI response mentions several eligible brands, count each mention separately for share-of-voice calculations, regardless of which brands the answer recommends.
Informational and comparison-oriented content also deserves attention. According to AthenaHQ’s State of AI Search report, informational content accounts for 35.06% of analyzed content intent in Consumer Goods & Retail, followed by comparative or selection content at 28.43% and acquisition-oriented content at 14.81%.
These findings suggest that e-commerce brands should measure visibility across the entire shopping journey, from early product research to purchase decisions.
Fix the Engines, Competitors, Geography, and Cadence
AI search engines don't always produce the same answers. Your brand might appear prominently in ChatGPT but receive fewer mentions in Perplexity or Google AI Overviews. That's why you need to measure performance across the platforms your customers use.
Once you've selected your platforms, keep your prompts, competitors, geographic markets, and reporting schedule consistent. Repeat each prompt to account for variability between responses. An external AI brand-tracking framework recommends running prompts three to five times per session and averaging the results.
You don't necessarily need to follow that exact frequency, but you should always use a repeatable process. For every response, record enough information to reproduce your findings and explain changes over time.
| Field to log | Why it matters | Example value |
| Exact prompt and cluster | Preserves tested search intent | Prompt text / comparison |
| Product or category | Defines measurement scope | Category label |
| Geography and language | Controls market differences | Country / language |
| Engine and visible model | Identifies the tested platform | Engine / model |
| Date, time, and response ID | Supports repeat runs and audits | Timestamp / unique ID |
| Competitor set | Maintains eligibility rules | Brand list |
| Brand mention status | Supports visibility calculations | Yes / no |
| Recommendation status | Separates recommendations from mentions | Yes / no |
| Mention order | Measures prominence | First / second / third |
| Competitors mentioned | Captures competitive presence | Brand list |
| Owned and third-party citations | Identifies referenced sources | URL lists |
| Sentiment and notes | Records framing and anomalies | Positive / short note |
Calculate and Report the Metrics That Matter
Once you've collected your responses, it's time to turn the data into actionable insights. The key is to use the right denominator for each metric.
Work Through a Hypothetical Calculation
Let's say you analyze 50 eligible AI-generated responses and record the following results:
- Your brand: 24 mentions
- Competitor A: 30 mentions
- Competitor B: 26 mentions
- Total eligible brand mentions: 80
- Responses citing your website: 10
Your mention share of voice would be:
24 ÷ 80 × 100 = 30%
Your citation share would be:
10 ÷ 50 × 100 = 20%
The difference comes down to what you're counting. Your 30% mention share of voice tells you how much of the competitive discussion your brand occupies. Your 20% citation share tells you how often AI-generated responses reference your website.
If an answer cites your domain multiple times, count that response only once when calculating citation share. These figures are hypothetical, but the calculation works the same way with your own data.
Segment Results Before Drawing Conclusions
An overall share-of-voice percentage is a useful starting point. But if you want to know where to focus your efforts, you'll need to look beyond the headline number.
Break down your results by:
- AI search engine
- Prompt cluster and purchase intent
- Product or category
- Competitor
- Geography and language
- Reporting period
For example, you might discover that your brand performs well in general product recommendations but rarely appears when shoppers ask for budget-friendly alternatives. Or perhaps your products receive frequent mentions in ChatGPT but relatively few citations in Perplexity.
These differences can help you prioritize your optimization efforts and identify opportunities to improve visibility.
Your dashboard should include mention share of voice, citation share, recommendation rate, average position, sentiment distribution, leading competitors, and changes over comparable periods.
| Dashboard view | Primary metric | Required breakdown | Decision it supports |
| Executive summary | Mention share of voice | Period and geography | Evaluate overall visibility |
| Engine performance | Recommendation rate | AI engine | Identify platform differences |
| Prompt clusters | Mention share of voice | Purchase-intent cluster | Find underrepresented journey stages |
| Product/category performance | Citation share | Product or category | Identify content coverage opportunities |
| Competitor comparison | Mention share of voice | Eligible competitor | Benchmark category presence |
| AI-referred outcomes | Revenue and conversions | Referral source and landing page | Evaluate commercial contribution |
Don't overlook citation-source analysis.
According to AthenaHQ’s State of AI Search report, the average owned-domain citation metric for Consumer Goods & Retail is 12.03%, compared with 14.93% across all industries.
The report also identifies YouTube, Reddit, Instagram, Facebook, and Amazon among the five most-cited off-page sources in Consumer Goods & Retail. That means your website is only part of the picture. Understanding which third-party sources AI engines cite can help you identify opportunities to strengthen your brand's presence across the wider web.
Connect AI Visibility to E-Commerce Outcomes Without Overstating Attribution
Getting mentioned in an AI-generated answer is valuable, but visibility alone doesn't tell you whether your efforts are contributing to sales.
To understand the business impact, you need to connect AI search performance with what shoppers do next.
Track Referral and Conversion Signals
Start by monitoring the following metrics for identifiable AI-referred traffic:
- Qualified referral sessions
- Product-page engagement
- Add-to-cart rate
- Conversion rate
- Assisted conversions
- Revenue
Keep your visibility reporting separate from revenue attribution. A brand mention, recommendation, or citation doesn't automatically mean that AI search caused a purchase.
Instead, use available referral data, campaign tags, analytics reporting, and documented assisted-conversion windows to evaluate how AI-driven visits contribute to business outcomes.
Keep in mind that traditional analytics tools won't capture every AI-influenced visit. Some AI platforms don't pass complete referral information, and shoppers may discover your products through AI search before returning through another channel to make a purchase.
AthenaHQ helps e-commerce teams monitor AI recommendation performance and analyze revenue attribution from identifiable AI-driven traffic. With visibility and commercial metrics in one place, SEO, analytics, brand, and commerce teams can develop a clearer understanding of how AI search contributes to performance.
Document Uncertainty and Interpretation Limits
AI search results can change from one query to the next. Model updates, personalization, geographic differences, and changes in external sources can all affect what you see.
To interpret your results accurately, document factors that could influence performance:
- Variability between responses and repeat runs
- Personalization, language, and location
- Model or interface updates
- Incomplete referral data
- Prompt-sampling bias
- Seasonal inventory, pricing, and demand changes
- Differences between owned and third-party citations
It's also worth annotating major website updates, marketing campaigns, product launches, catalog changes, and measurement revisions on your reporting timeline.That way, when your share of voice changes, you have a better starting point for understanding why.
Continuous monitoring matters because the sources AI engines cite can change over time. AthenaHQ's State of AI Search report highlights the volatility of source rankings and recommends a consistent, long-term content strategy rather than chasing short-lived fluctuations.
Your goal is to build a reliable picture of performance within a controlled sample, not to account for every AI-generated answer or customer interaction.
Turn a Consistent Baseline Into Better Decisions
Measuring AI share of voice gives e-commerce brands a clearer understanding of how they appear in AI-generated answers and where they stand against competitors.
Start with a representative set of prompts, select the platforms you want to monitor, and establish consistent measurement rules. Track mentions, recommendations, citations, position, and sentiment separately, then break down the results to identify meaningful differences across products, purchase-intent clusters, and AI engines.
From there, connect visibility data with referral traffic, engagement, conversions, and revenue to understand how AI search contributes to your broader e-commerce strategy.
AthenaHQ helps brands monitor their visibility across AI search platforms, benchmark competitors, identify citation sources, and connect AI search performance with measurable business outcomes.
With the right measurement process in place, you can move beyond simply asking whether AI engines mention your brand. Instead, you'll know where your brand performs best, where competitors have an advantage, and which improvements are worth prioritizing.
Frequently Asked Questions
What Is AI Share of Voice in E-Commerce?
AI share of voice measures how frequently an e-commerce brand appears in AI-generated answers relative to competitors across a defined set of search prompts. It helps marketers evaluate competitive visibility in platforms such as ChatGPT, Perplexity, Gemini, and Google AI Overviews.
How Do You Calculate Brand Share of Voice in AI Search?
Divide your brand's eligible mentions by the total number of eligible brand mentions across your tracked competitive set, then multiply by 100.
AI share of voice = (Your brand mentions ÷ Total competitor-set mentions) × 100
Use consistent prompts, AI engines, geographic markets, and reporting periods to ensure comparable results.
What Is the Difference Between AI Brand Mentions and Citations?
A brand mention occurs when an AI-generated answer names your brand. A citation occurs when the answer references a source, such as your website or a third-party publication. Track both because AI platforms can mention your brand without citing your website.
How Often Should E-Commerce Brands Measure AI Share of Voice?
Weekly or monthly reporting provides a practical starting point for monitoring changes in AI visibility. Run prompts multiple times within each measurement session to account for response variability, and maintain a consistent schedule when comparing results.
What Is a Good AI Share of Voice for an E-Commerce Brand?
A good AI share of voice depends on your product category, competitive set, prompt portfolio, and AI platforms.
For reference, AthenaHQ’s State of AI Search report found that leading Consumer Goods & Retail brands average 33.98% share of voice across tracked competitive sets. Use industry benchmarks alongside your own historical performance rather than treating a single percentage as a universal target.
Which AI Search Engines Should E-Commerce Brands Monitor?
Prioritize the platforms your customers use for product discovery and purchase research. Common platforms include ChatGPT, Perplexity, Google AI Overviews, Google AI Mode, Gemini, Claude, Copilot, and Grok. Monitor multiple engines because brand mentions, recommendations, and citations can differ across platforms.
Can AI Share of Voice Be Connected to E-Commerce Revenue?
Yes, but visibility alone does not establish revenue attribution. Compare AI share of voice with identifiable AI referral traffic, product-page engagement, conversions, assisted conversions, and revenue. Use a documented attribution methodology and account for visits that cannot be directly attributed to AI search.
How Can E-Commerce Brands Improve AI Search Visibility?
Start by identifying underrepresented product categories, purchase-intent prompts, and AI platforms. Improve informational content, product comparisons, product-page information, and third-party brand presence based on the sources AI engines cite. Monitor performance consistently to evaluate whether these changes coincide with improved brand mentions, recommendations, and citations.
Become the Brand AI Trusts
See, Act, and Win on AI Search and Beyond
Keep Reading
Top 10 Generative Engine Optimization Tools To Try in 2026
The best GEO tools to get your brand mentioned when AI search engines answer questions in your industry. Search traffic is predicted to drop 25% by 2026.
Enterprise AEO 101: What You Need to Know to Boost AI Search Visibility in 2026
Learn how enterprise AEO and GEO can improve AI search visibility in 2026, from prompt measurement and citation-ready content to platform evaluation and attribution.
Enterprise GEO Prompts: Strategies for Scaling AI Search Visibility
Enterprise GEO provides a practical way for large teams to organize buyer questions, measure answers across engines, find citation gaps, invest in changes that carry real business value, and ultimately scale their AI search visibility.
See AthenaHQ in Action
 AthenaHQ
 Cozy Earth
The Most-Cited Sleepwear Brand in AI Search
Cozy Earth used AthenaHQ to protect its lead in sleepwear, identify a loungewear opportunity, and give its two-person content team a clearer way to prioritize what to publish next.
AthenaHQ Rootly
10x Increase in Citation Rate
GEO became Rootly's #1 growth pillar. With ~10x citation rate growth and +126% mention rate on non-branded prompts, Rootly transformed AI Search into an executive-level operating channel.
AthenaHQ Lago
50% Increase in Demos from AI Search
Lago achieved a 50% increase in demos from AI Search after implementing Athena. With 11x growth in AI Overview impressions and exploding citations, Athena became their command center for GEO.